On the evening of July 29, 2026, Meta — one of the largest companies on Earth, covered by dozens of analysts — reported quarterly results after the close. The next day the stock closed 8% lower: its first earnings-per-share miss in about three years, plus a scare about how much cash its AI build-out is burning. Every earnings season delivers a version of this story, and every version teaches the same lesson: the day after earnings is one of the least predictable days in markets. This page shows that with data — one famous company, every earnings report since 2022, real prices.
One company, nineteen report cards
Here is the next-day stock reaction to each of Meta's nineteen quarterly earnings reports from 2022 through mid-2026 — same company, same management, same analysts studying it each quarter:
The spread runs from −26.4% to +23.3% — and the direction split ten up, nine down. That's a coin flip, from investors who knew this company as well as any company can be known. If the most-analyzed stocks on the planet gap like this, the idea that an ordinary investor can reliably guess the direction of the next print is not humility short — it's math short.
The number isn't the news
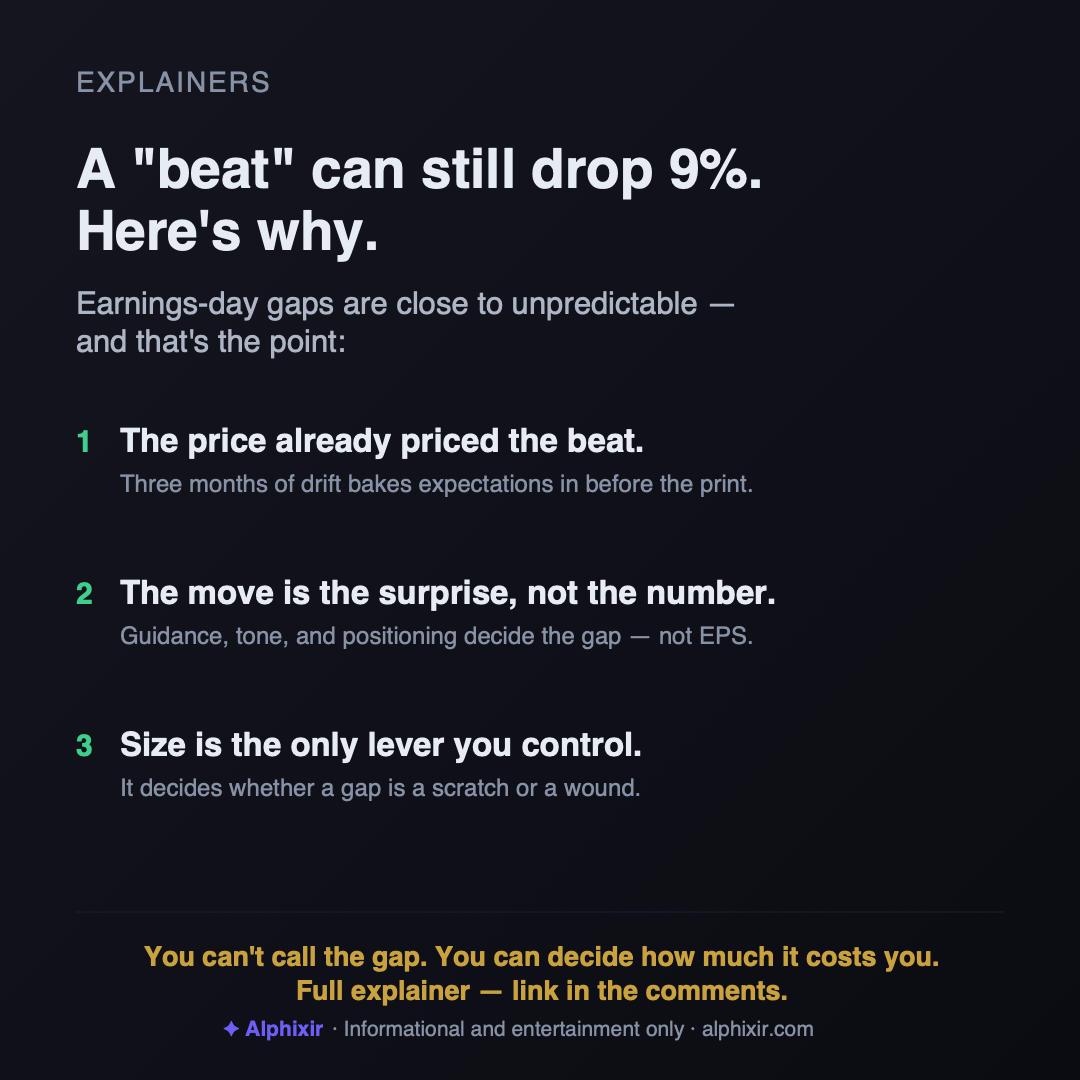
The reflex explanation is "stocks go up on beats and down on misses." The record says otherwise. The price already contains the expectation: by the time a company reports, its stock has spent three months drifting to a level that bakes in what the crowd thinks is coming. What moves the stock is the surprise — plus guidance, the tone of the call, one line about spending, and positioning: who was already long, who has to sell, who was hedged. Four of the most famous gaps in the chart above make the point:
| Report | The headline result | Next day | What actually happened |
|---|---|---|---|
| Feb '22 | EPS missed; guidance light; first-ever decline in daily users | −26.4% | At the time, the largest one-day market-value loss of any U.S. stock in history |
| Feb '23 | Reported EPS came in below consensus (restructuring charges); revenue edged past; $40B buyback | +23.3% | A headline "miss" — and one of the best days in the stock's history |
| Apr '24 | EPS beat comfortably; revenue beat too | −10.6% | Punished anyway — for heavier AI-spending guidance |
| Oct '25 | Revenue beat; reported EPS crushed by a one-time tax charge | −11.3% | The "good" quarter that cost 11% overnight |
| Jul '26 | First EPS miss in about three years; free-cash-flow worries | −8.0% | The report this article opened with |
February 2023 is the cleanest specimen: reported earnings came in below consensus, and the stock had its best day in a decade — because a buyback and a cost-cutting promise mattered more than the print. April 2024 is the mirror image: a comfortable beat, punished 10.6% for a single guidance line about AI spending. "Beat" and "up" are simply not the same event. Neither are "miss" and "down."
You can't dodge it by reading the tape
Maybe the chart just says earnings days are wild, but a disciplined observer could still lean on momentum — surely a stock that rallied into the report tells you something? It doesn't. Across these nineteen events, the direction of the prior month's drift matched the direction of the earnings reaction 9 times out of 19. A coin does that. And you can't simply "trade around" the event either, because the gap happens overnight, while markets are closed — by the opening bell the move is already done. What makes this genuinely dangerous is the size of the thing you can't predict:
A typical earnings reaction is roughly eight times a normal trading day — an unpredictable direction attached to an outsized magnitude. That combination is the definition of a bad bet: you're flipping a coin for stakes eight times higher than usual.
The one lever you actually control
So if you can't predict the gap, what can you do? Control the one variable that's entirely yours: how much you hold. This is position sizing, and it's the difference between an earnings surprise being a scratch or a wound. Two investors can own the identical stock through the identical −26.4% day; for the one who sized it at 3% of a portfolio it's a bad morning, and for the one who made it 30% it's a rethink of their year. You don't get to choose the gap. You always get to choose the exposure.
This is exactly how our engine treats single-stock events. It doesn't try to call which way an earnings report breaks — that's the un-forecastable part. Instead, every position is sized to conviction and volatility and then capped: each strategy has a hard single-position limit, from 15% of the book for the Conservative strategy up to 35% for the Aggressive one. The arithmetic is the whole point — held at a 15% cap, even a Meta-style −26.4% earnings day costs the book at most about 4%; at the 35% cap, about 9%. Painful, survivable, and never the whole story. The upside gets captured across many positions; no single print gets to write the ending. It's not a prediction about any company. It's a posture about all of them.
One honest caveat our own small-sample rule requires: nineteen events is enough to show the spread and the coin-flip direction, not enough to fit a strategy on. That's the point — if nineteen observations of the best-covered stock on Earth can't be traded reliably, your sample of "this time feels obvious" is smaller still.
1. Earnings reactions are surprise-driven, not result-driven: across 19 reports of one megacap, a miss soared +23.3% and comfortable beats fell 10.6% and 11.3%.
2. The direction is a coin flip (10 up / 9 down) and the prior month's trend called it 9 times out of 19 — but the stakes are ~8× a normal day, and the move happens overnight.
3. The only lever you fully control is exposure: a hard cap on position size turns the same −26% gap from a catastrophe into arithmetic. A pattern in the data, not a prediction.
Informational and entertainment content only. Not investment advice. Charts and tables are built from Tiingo daily price data (META adjusted close, close-to-close); report details as widely reported at the time. No individual security is a recommendation. Past patterns are not predictions.