Scroll any finance feed long enough and you'll meet it: a chart with an indicator that supposedly marked every major top since 1987, or a signal with a "100% hit rate." It looks like a superpower. It's usually the opposite — the clearest sign that a backtest is broken.
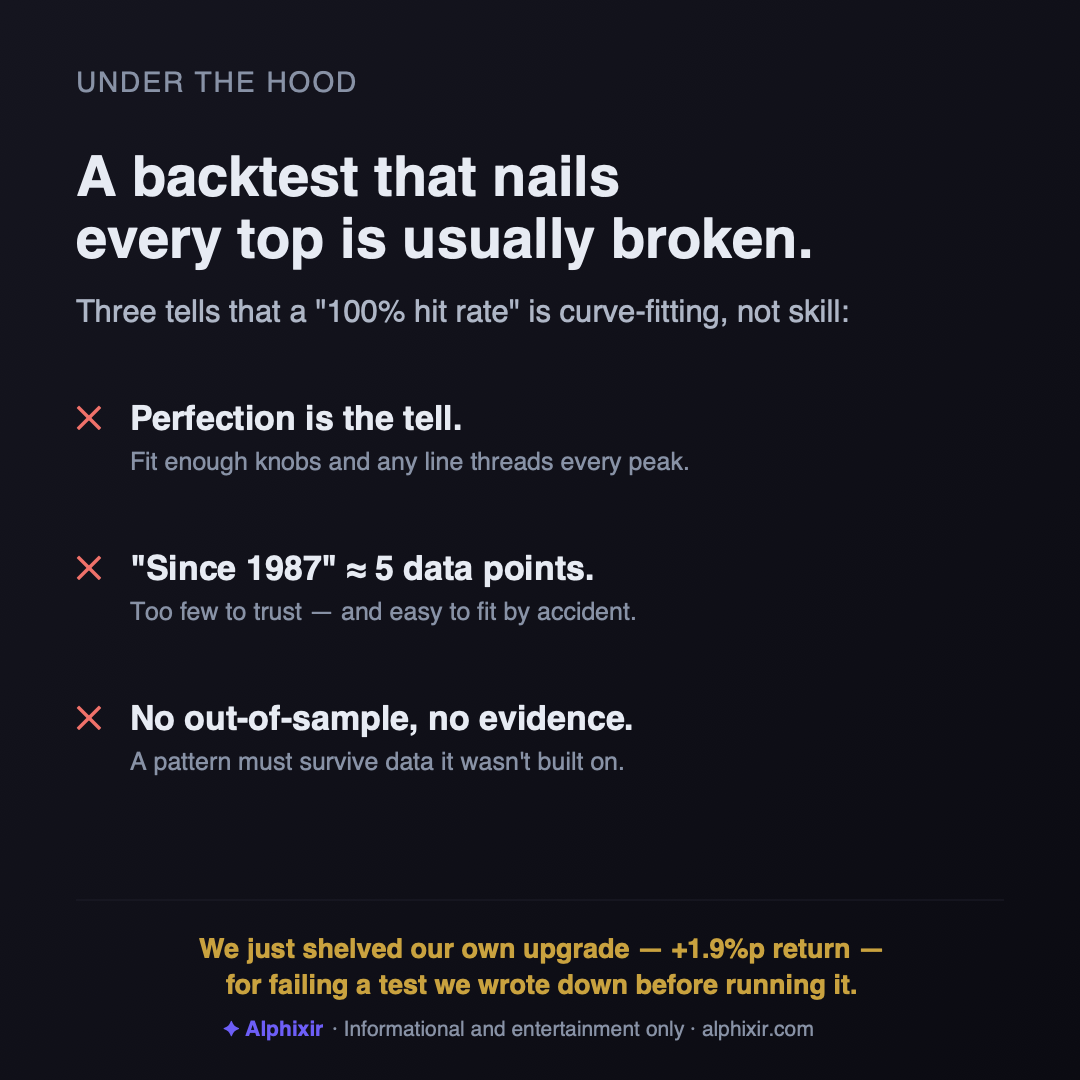
Here's the uncomfortable truth about testing strategies on history: if you're allowed to keep adjusting a rule until it fits the past, you can always get it to fit perfectly. Give a curve enough knobs — a threshold here, a lookback there — and it will thread every historical turning point like a needle. That's not skill. That's curve-fitting: memorizing the answers to a test you've already seen. The tell is the perfection itself. Real signals are noisy; a rule that's never wrong on history has almost always been tuned, consciously or not, until it couldn't be.
The second problem hides behind the first: small samples. "Marked every top since 1987" often means five or six events across forty years. Five data points can't tell you much about anything — you could fit those five with a dozen unrelated indicators and each would look prophetic. A pattern needs to survive data it was not built on before it earns any trust. That's the difference between in-sample (the history you tuned on) and out-of-sample (everything after) — and it's where most "perfect" signals quietly fall apart.
What a perfect record actually proves — the math
You don't have to take that on vibes; there's a standard piece of statistics for it. Ask: if a signal's true hit rate were only so-so, how often would it still produce a perfect streak this long? Run that question in reverse (a 95% binomial confidence bound) and you get the honest floor under any n-for-n record. The answer is deflating:
Five perfect calls — the classic viral chart — are statistically indistinguishable from a 55% coin. A coin that lands heads 55% of the time will come up heads five straight about one time in twenty; with thousands of indicators being data-mined at all times, those five-for-five "prophets" are a mathematical certainty, not a discovery. Even twenty consecutive hits can't rule out an 86% process. It takes 29 straight wins before the data alone proves a hit rate better than 90% — and streaks like that are essentially never on offer:
| Perfect record | Proves (95% conf.) | Sounds like | Honest reading |
|---|---|---|---|
| 5/5 | ≥ 55% | Five tops "called" since 1987 — the classic viral chart | A coin landing heads 55% of the time could plausibly do this |
| 10/10 | ≥ 74% | A year of monthly calls, all correct | Still consistent with a 74% coin — good, far from perfect |
| 20/20 | ≥ 86% | Twenty straight winners | Impressive — yet an 86% process produces this run routinely |
| 29/29 | ≥ 90% | 29 consecutive hits | The first sample size that actually proves a >90% rate |
| 50/50 | ≥ 94% | Fifty straight hits | Now the data speaks: at least ~94% — runs like this are essentially never shown, because they don’t exist |
So how do you keep yourself honest? The discipline that actually works is boring and a little painful: pre-registration. Before you run the test, you write down exactly what would count as success — the metric, the threshold, how many shots you get — and then you take that shot once. No peeking, no re-running with a tweaked parameter because the first result was disappointing. If it fails, it fails; you don't get to sweep the settings until it passes. That single rule kills most curve-fitting, because it removes the freedom to fit.
We hold ourselves to exactly that — and it costs us. This week we killed one of our own engine upgrades. A change to how much capital the engine deploys improved 20-year annualized return by about +1.9 percentage points and lifted upside capture by 7–8 points — genuinely better on the headline numbers. But we'd pre-registered a drawdown limit before running the test, and in the 2020 crash the same change deepened the drawdown past that limit. So it failed, one shot, and we shelved it. The tempting move — nudge one constant until the drawdown squeaks under the line — is precisely the curve-fitting we refuse to do. And because the only test that can't be curve-fit is the one that hasn't happened yet, every pick our engine makes is sealed before the open and scored in public, win or lose, on our forward track record — the out-of-sample exam, running live.
None of this means signals are useless. Volatility, leverage, breadth, rates — these carry real information about market posture. But information is not a countdown clock. The honest use of a signal is to lean with the odds, not to claim you've found the one line that calls every top. When someone shows you a backtest that never misses, the most useful reaction isn't awe. It's the question every quant learns to ask first: what did they have to break to make it look this good?
1. A perfect historical record is the tell, not the flex: five flawless calls prove nothing beyond a 55% coin, and even 20-for-20 can't rule out an ordinary process.
2. The fix is pre-registration — define success before the test, take one shot, accept the result. We just killed a +1.9pp upgrade of our own this way.
3. The only backtest that can't be fit is the future. Judge any signal — including ours — on sealed, out-of-sample calls, not on how well it remembers the past.
Informational and entertainment content only. Not investment advice. Confidence bounds are exact binomial calculations; the engine figures cited are hypothetical, from our own 20-year backtest. Past patterns — even convincing ones — are not predictions.