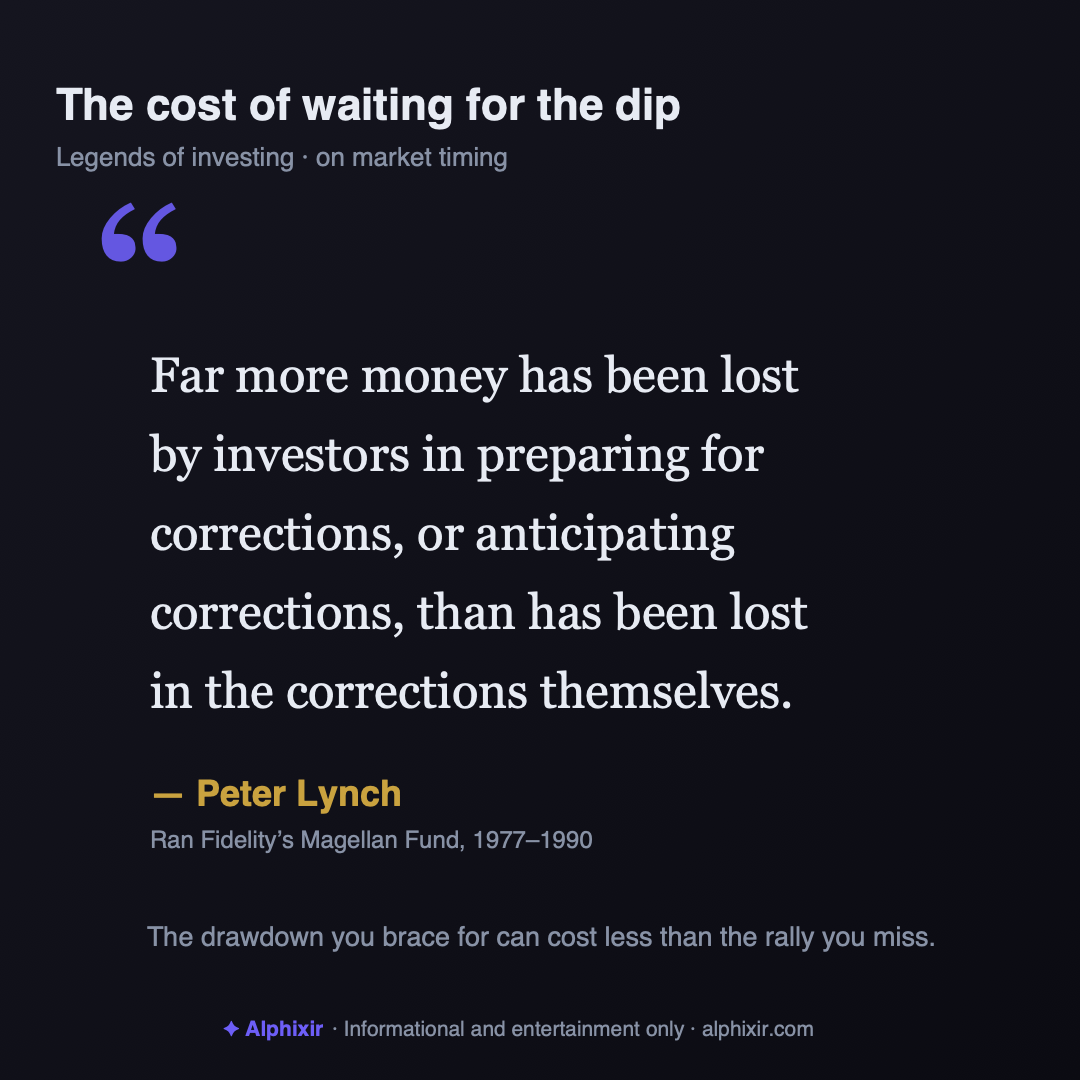
Peter Lynch ran Fidelity's Magellan Fund from 1977 to 1990 and compounded it at roughly 29% a year — one of the great runs in fund history. So it's worth sitting with the fact that his most quoted line is not about picking winners. It's about the quiet cost of caution:
"Far more money has been lost by investors in preparing for corrections, or anticipating corrections, than has been lost in the corrections themselves." — Peter Lynch, 1995
What would an investor working from Lynch's public principles make of a nervous market? Probably not a dramatic exit. The trap he described is subtle: the correction you dodge is visible and memorable, while the gains you forfeit sitting in cash — waiting for a dip that keeps not arriving — are invisible. You never get a statement for the rally you missed. So the cost never feels like a cost, and the habit persists.
That maps onto a second Lynch idea: you cannot time the market, so stop trying to. He argued the big advances often arrive in short, unpredictable bursts, frequently near the moments of maximum discomfort — precisely when the market-timer has stepped aside to "wait for clarity." Miss a handful of those days and a career's worth of compounding thins out. His answer wasn't bravado; it was staying in the game and doing the homework, so you actually understand what you own when it drops.
Lynch's claim, run against 33 years of data
That is a testable claim, so we tested it. Take the S&P 500 through SPY (the oldest U.S. ETF, dividends reinvested) from its January 1993 launch to today — 8,400+ trading days. Invest $100 and simply hold, and it grows to about $3,100. Now delete just the ten best days out of those 8,400 — the equivalent of being "safely on the sidelines" for two trading weeks spread across 33 years:
More than half the entire outcome hinged on ten days. And here is the part that vindicates Lynch's specific wording — that the bursts come at the moments of maximum discomfort. These are the ten best days in the whole sample. Look at the third column: every single one arrived while the market was already deep underwater:
| # | Date | SPY day gain | Market was at (vs peak) | What was happening |
|---|---|---|---|---|
| 1 | Oct 13, 2008 | +14.5% | -42% | Depths of the global financial crisis |
| 2 | Oct 28, 2008 | +11.7% | -45% | Depths of the global financial crisis |
| 3 | Apr 9, 2025 | +10.5% | -19% | 2025 tariff-shock rebound |
| 4 | Mar 24, 2020 | +9.1% | -34% | COVID crash |
| 5 | Mar 13, 2020 | +8.5% | -27% | COVID crash |
| 6 | Mar 23, 2009 | +7.2% | -49% | The GFC bottom |
| 7 | Nov 24, 2008 | +6.9% | -48% | Depths of the global financial crisis |
| 8 | Apr 6, 2020 | +6.7% | -26% | COVID crash rebound |
| 9 | Nov 13, 2008 | +6.2% | -44% | Depths of the global financial crisis |
| 10 | Oct 20, 2008 | +6.0% | -39% | Depths of the global financial crisis |
An honest caveat: the mirror-image stat also exists — an investor who missed the ten worst days would have done far better. But nobody gets to choose which days they miss. What the clustering shows is the mechanism: the best days and the worst days live next to each other, inside the same panics — 14 of the 20 best days came within a month of one of the 20 worst. The investor who sells after the crash days, "waiting for clarity," is systematically positioned to miss the rebound days sitting right beside them. That — not some abstract arithmetic — is how the money Lynch talked about actually gets lost.
None of this means ignore risk. Lynch was blunt about knowing your holdings and having the stomach for declines — "the key organ here is the stomach, not the brain." The point is where the danger really lives: not in the correction itself, which passes, but in the self-inflicted damage of trying to sidestep it and getting the round trip wrong twice — out too early, back in too late.
We find this a useful lens for a machine that has to decide, every single morning, how much to risk. Our engine doesn't predict corrections either. It reads the market's current posture and sizes to it — leaning defensive when conditions warrant, but rarely stepping fully aside — and then it shows its work. The temptation Lynch named, the urge to "prepare" by fleeing, is exactly the reflex a disciplined process is built to resist.
1. Lynch's warning is measurable: $100 fully invested since 1993 became about $3,100 — missing just the 10 best days cut it to about $1,345. Half the outcome lived in ten days.
2. His "moments of maximum discomfort" line checks out — 19 of the 20 best days struck while the market was already 10%+ below its peak, and 14 of them within a month of one of the 20 worst days.
3. The rebound days live inside the panics, not after them — which is why exits made "for clarity" are so expensive. A pattern in past data, not a prediction or a strategy.
This is a thought experiment built on Peter Lynch's publicly stated principles and quotations; it does not represent his views on any current market or security, and no endorsement is implied. Chart and table are computed from real Tiingo SPY data (adjusted close, dividends reinvested); the "missing the best days" comparison is a hypothetical illustration, not an investable strategy, and past performance does not guarantee future results. Informational and entertainment content only. Not investment advice.