Two summers ago, one of the scariest days in recent market memory grew out of one of the calmest tapes of the year — and it was almost entirely over in two weeks. The mechanism is worth understanding, because it had little to do with earnings, growth, or anything most investors were watching. And in 2026, with the yen back near multi-decade lows, the same machinery is back in the headlines.
The build-up: years of cheap yen
For years, investors borrowed yen at near-zero cost and parked the proceeds in higher-returning assets around the world — U.S. tech, emerging-market bonds, you name it. That's the yen carry trade: one of the market's largest and least visible pieces of plumbing. It was cheap, it was crowded, and it worked — right up until the borrowing currency started to rise. You can see the whole arc in the funding currency itself:
By early July 2024 the yen had slid to about ¥161.5 per dollar — its weakest in decades. Then the reversal began, and — here's the detail most retellings skip — it started before the Bank of Japan moved. A soft U.S. inflation print on July 11 and reported intervention from Tokyo had already pushed the yen up sharply through mid-July. When the BOJ raised rates on July 31 — from a 0–0.1% range to 0.25%, a modest move on its own — it lit the fuse on a trade that was already burning.
Two weeks in August
When the borrowing currency rises, every levered carry position loses money on its funding leg at once. Rising funding costs forced position after position to be unwound, and the selling fed on itself — margin calls begetting margin calls, across every asset the borrowed yen had bought.
| Date (2024) | What happened | USD/JPY | SPY day move |
|---|---|---|---|
| Jul 3 | Yen at its weakest in decades; U.S. indexes near record highs | ¥161.5 | — |
| Jul 11 | Soft U.S. CPI print; reported yen-buying intervention from Tokyo | ¥158.6 | — |
| Jul 31 | BOJ hikes from 0–0.1% to 0.25%, its highest since 2008 | ¥150.4 | +1.6% |
| Aug 2 | Weak U.S. jobs report stokes growth fears; unwind accelerates | ¥147.0 | −1.9% |
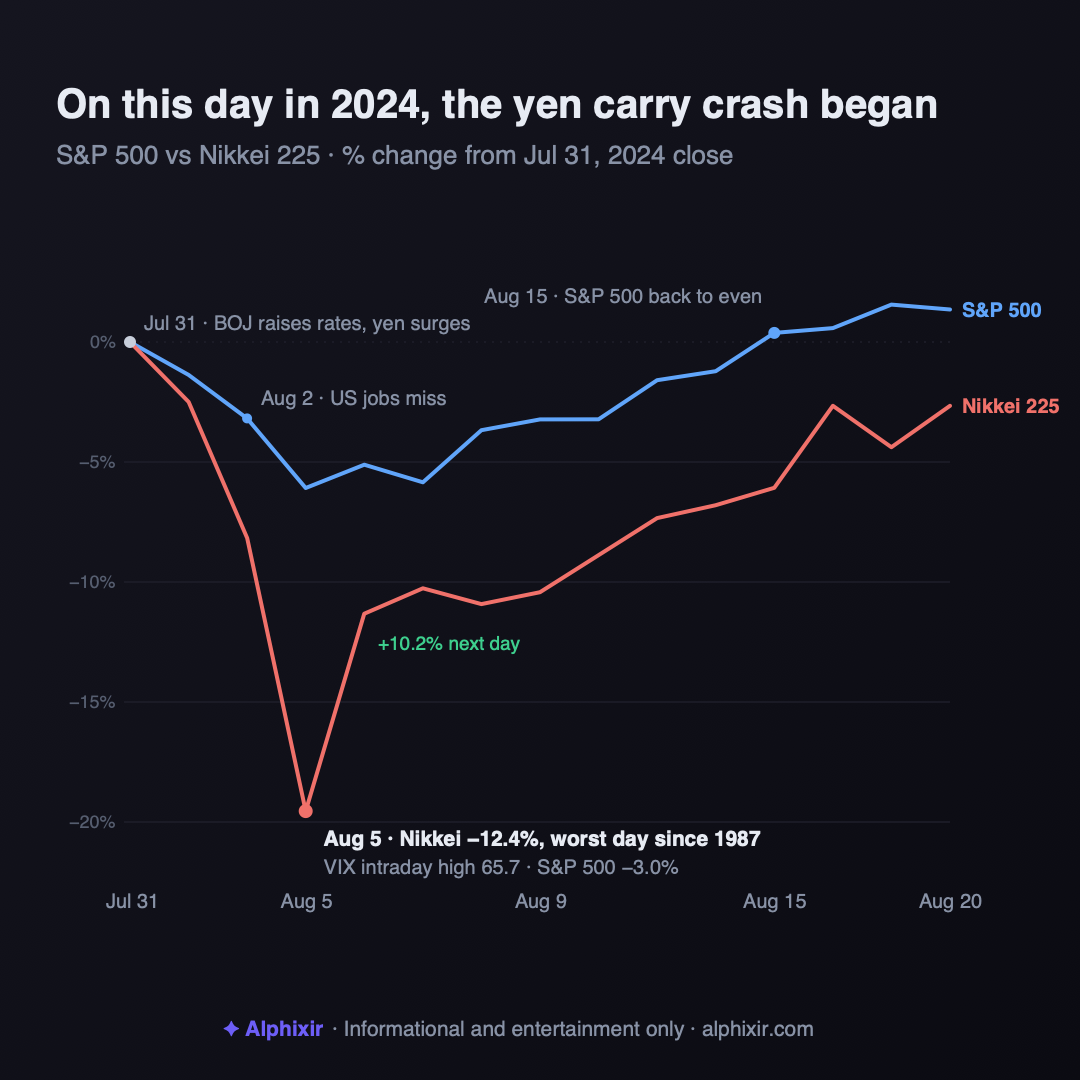
| Aug 5 | Peak panic: Nikkei −12.4% (worst since 1987), VIX 65.73 intraday | ¥143.9 | −2.9% |
| Aug 15 | Strong U.S. data; S&P 500 back above its July 31 close — round trip complete | ¥148.9 | +1.7% |
For a few hours on August 5 it felt like the start of something much larger. It wasn't. Measured from the July 31 close, the S&P 500 was back above even by August 15 — an 11-session round trip:
Two lessons that pull in opposite directions
The first: the biggest risks often hide in market structure, not the news. No earnings miss, no recession print, no obvious villain — just a crowded funding trade unwinding through the machinery underneath. If you were only reading the front page, the move looked like it came from nowhere. It didn't; it came from the plumbing. And as the chart above shows, the pressure had been building for weeks before the headline day.
The second: the scariest day is frequently a terrible time to act. An investor who panic-sold into the August 5 low locked in the loss and then had to decide when to get back in — before the recovery, or after. The round trip punished the reaction more than the event. This is the recurring shape of these episodes, from 1987 to 2020's 33-day crash: the panic is real, and so, usually, is the recovery.
Where the yen stands now (August 2026)
The 2024 unwind didn't end the story — it barely paused it. The Bank of Japan has kept normalizing, in slow, deliberate steps:
| Date | BOJ move | Policy rate |
|---|---|---|
| Jul 2024 | The hike that lit the fuse | 0.25% |
| Jan 2025 | Second step — highest since 2008 | 0.50% |
| Dec 2025 | Third step, as 10-year JGB yields pass 2% | 0.75% |
| Jun 2026 | First 1%-handle since 1995 | 1.00% |
| Jul 2026 | Hold at 1.00%, with a warning that core inflation may exceed the 2% target | 1.00% |
Here's the part that makes 2026 interesting: four hikes later, the yen is weak again. In late July 2026 it traded past ¥164 per dollar intraday — around its weakest in roughly four decades — before a sudden, reportedly intervention-driven snap back toward ¥157. Why? Because carry is funded by the gap between rates, not the level: even at 1%, yen funding remains far cheaper than dollar rates, and the trade that unwound so violently in 2024 has quietly rebuilt. That's why "yen carry trade" is back in headlines — and why the August 2024 playbook is worth keeping fresh in memory. None of this predicts the next unwind; it just says the plumbing is pressurized again.
Our engine can't predict the next carry unwind any more than anyone else can. What it can do is read the market's posture as it shifts and size positions to the tape rather than to the panic — staying deliberate on exactly the mornings when the instinct is to flee. Days like August 5 are why that discipline exists.
1. Structural risk hides in funding trades, not headlines — the 2024 crash needed no bad news, only crowded plumbing reversing.
2. Violent structural unwinds have tended to round-trip fast — the S&P 500 took 11 sessions in 2024. Panic-selling the low was the costliest choice.
3. In 2026 the ingredients are back: BOJ at 1% (highest since 1995), the yen near multi-decade lows, carry back in the news. A pattern to understand, not a prediction.
Informational and entertainment content only. Not investment advice. Charts and tables are built from FRED (DEXJPUS) and Tiingo (SPY adjusted close) data; BOJ policy details from official statements and major-outlet reporting. Past patterns are not predictions.