On August 7, 2026, SK Hynix's board approved a combined 54.3 trillion won — $38.1 billion — for two new memory fabs. Coverage treated it as confirmation: the AI memory boom is real, and the industry's biggest supplier is doubling down. That reaction skips the one detail that actually matters for anyone pricing memory stocks today. Neither fab ships a wafer before 2028. The headline is about money committed now; the market impact is about a calendar that stretches years into the future — and memory has run this exact play, capex now and consequences later, twice before in the last decade.
What was actually approved, and when it ships
The two fabs split cleanly by product. Yongin Y2 takes the bigger share — 35.2 trillion won (roughly $24.7B) — and is earmarked for HBM and next-generation DRAM, the high-margin memory that sits directly on AI accelerator boards next to GPUs. Cheongju M17 gets 19.1 trillion won (roughly $13.4B) for AI-focused NAND flash. SK Hynix framed the reasoning around timing, not just scale: in an AI market where every hyperscaler is racing to secure supply, being able to deliver the exact volume a customer needs, when they need it, is itself the competitive edge — arguably more than any single spec sheet.
The catch is the build clock. Construction on both sites is targeted to begin around 2027, with Cheongju M17 aiming for production in 2028 and the larger Yongin Y2 line following in 2029. That is a normal timeline for a leading-edge fab, not a warning sign — semiconductor plants routinely take two to three years from groundbreaking to meaningful output. But it means this specific $38.1 billion does nothing to the supply side of the memory market between now and then. If AI memory is genuinely undersupplied today, as SK Hynix, Micron, and multiple hyperscalers have said in 2026 earnings commentary, this announcement doesn't relieve that — it locks in that the shortage, if real, has years left to run before this round of capacity even exists.
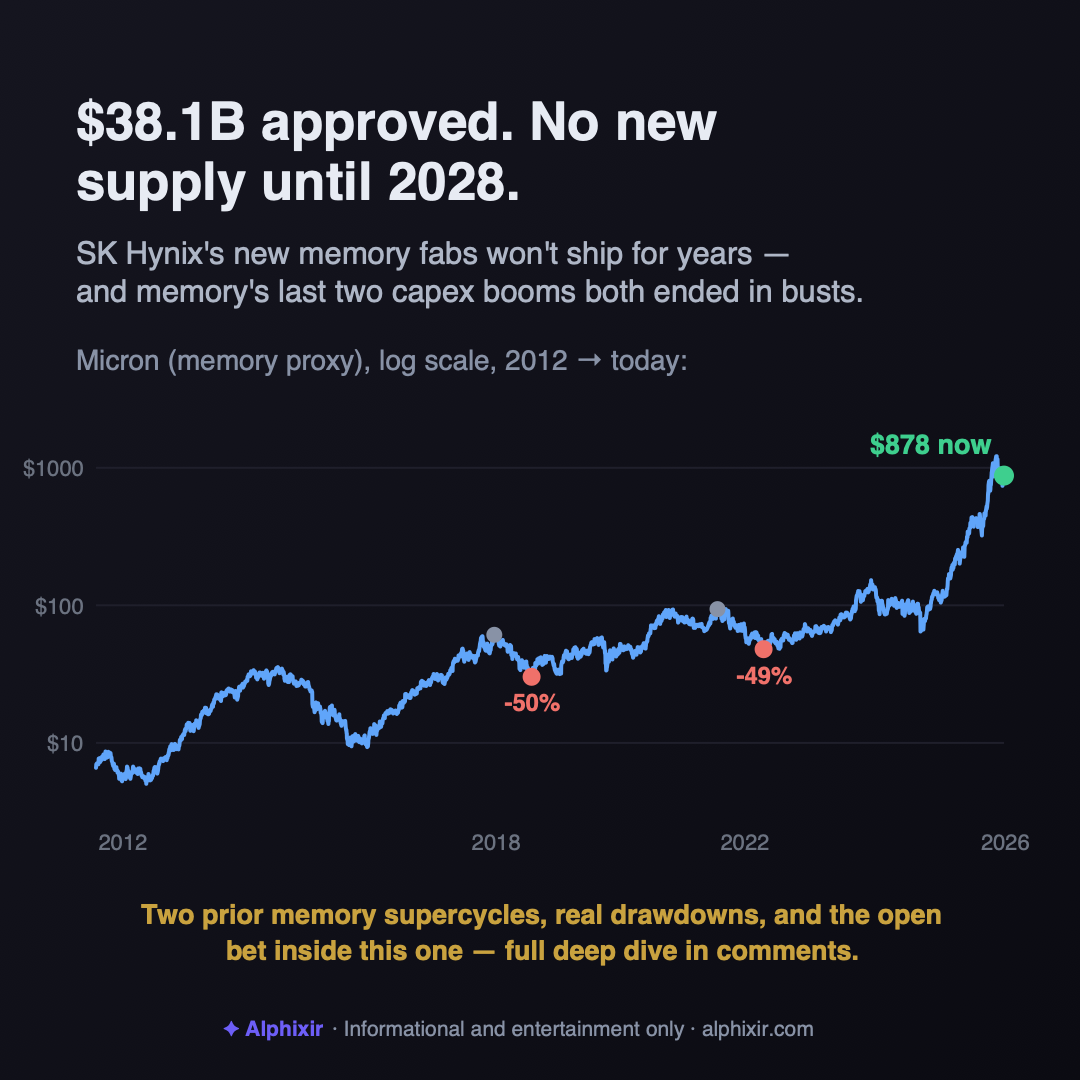
Memory doesn't have a long public trading history in Korea for a U.S. reader to chart directly, but it has one in the U.S.: Micron (MU), the largest American-listed memory maker, on the same DRAM/NAND/HBM cycle as SK Hynix. Its price history is the cleanest available record of what memory capex supercycles have actually done to memory stocks before:
Both marked drawdowns above came after an investment boom that looked, at the time, exactly like this week's SK Hynix news — an industry racing to meet demand it believed was permanent. The mechanism each time was the same: capex chases a shortage, capacity eventually catches up (sometimes overshoots), and price does what commodity price always does when supply meets demand from behind. It is worth noting where our own engine already stood on this name the day the news broke: on August 7 — coincidentally, on Amazon's separate $220B AI-capex disclosure rather than the SK Hynix news itself — three of Alphixir's four strategies were already long MU (entry $900.89, position sizes of roughly 0.3%–0.5% of each book). A modest, pre-existing view, not a fresh bet on a headline.
Memory's two prior boom-bust rounds
The pattern isn't a one-off. It's the closest thing the chip industry has to a recurring event:
| Cycle | Capex driver | MU peak → trough | What confirmed the bust |
|---|---|---|---|
| 2017–2019 | Cloud/hyperscaler DRAM buildout | $61.05 (5/29/18) → $30.22 (1/3/19), −50.5% | Global DRAM market value fell roughly 22% year over year in 2019, per IHS Markit estimates at the time |
| 2021–2023 | Pandemic-era PC/server demand | $93.90 (12/29/21) → $47.93 (9/26/22), −48.9% | SK Hynix posted a full-year operating loss of 7.73 trillion won in 2023 — its first annual loss in years, after four straight quarterly losses |
| 2026–2029 (current) | AI/HBM buildout — this SK Hynix approval, plus industry-wide capex | MU +207.7% YTD 2026, record highs | Unknown — the new capacity from this announcement doesn't ship until 2028–29 |
Both prior cycles also show up as the two worst years in Micron's own trading history over the last decade — and the swings in between are just as telling as the crashes:
Structural or cyclical — the bet inside every AI memory stock
There's a real argument that this time is different, and it isn't a weak one. Prior memory cycles were driven by commodity demand — PCs, smartphones, generic servers — where memory is a fungible input and price is the only lever. HBM is not that. It's a custom, tightly-coupled component qualified against a specific AI accelerator's roadmap, sold at a fraction of the margin structure of commodity DRAM, with a small number of qualified suppliers. If AI compute spending keeps compounding the way Amazon's, Microsoft's, and Meta's 2026 capex guidance suggests, the demand side of this cycle may simply be larger and stickier than anything memory has served before.
The counter-argument is just as real, and it's the one the calendar keeps pointing at: the industry's incentive structure hasn't changed. When margins expand, every supplier — not just SK Hynix — has the same reason to approve the same kind of capex at the same time, aimed at the same demand story. That's precisely what happened in 2017–18 and again in 2021, and it's exactly what "record capex approvals across the memory industry" looks like from the inside of both prior booms, in real time, before anyone knew how they'd end. Whether AI/HBM demand is structurally different enough to absorb 2028–29's new capacity without a repeat isn't something this announcement — or any single data point — can answer today. It's the actual, open bet embedded in every "AI memory" stock right now.
1. The calendar is the real news: $38.1B in new memory capacity doesn't touch supply until 2028–29 — if the current shortage is real, this announcement guarantees it has years left to run, not quarters.
2. Memory has round-tripped a capex boom into a bust twice in the last decade — Micron alone fell −50.5% in 2019 and −48.9% in 2022–23 — and the capex-chases-price mechanism behind both hasn't been engineered away.
3. Whether HBM/AI demand is structural enough to break that pattern is the open question, not a settled one. History here is a pattern, not a prediction.
Informational and entertainment content only. Not investment advice, and never a recommendation to buy or sell any security. SK Hynix investment figures and fab timelines per the company's August 7, 2026 disclosure, as widely reported by Korean and international outlets. DRAM market-value figures per IHS Markit estimates, as widely reported. SK Hynix 2023 financial results per company disclosures, as widely reported. Micron (MU) price data and all computed drawdowns/returns from Tiingo adjusted-close data. Engine data (positions, weights) comes from Alphixir's sealed virtual-portfolio record — simulated positions, no real money. Past patterns are not predictions.